How to Calculate Cohort ROAS: A Worked Example
Learn to calculate cohort ROAS from matched spend and revenue using a fully checked mobile game example.

Cohort ROAS compares ad spend with revenue from the same acquired users. It stops older players, organic installs, and a busy revenue week from making a new campaign look better than it is. This worked example uses one fictional mobile puzzle game cohort and checks every number through D30.
The arithmetic is simple. The discipline is in matching the spend, installs, and revenue to one acquisition cohort before making a budget decision.
Start cohort ROAS with one acquisition window
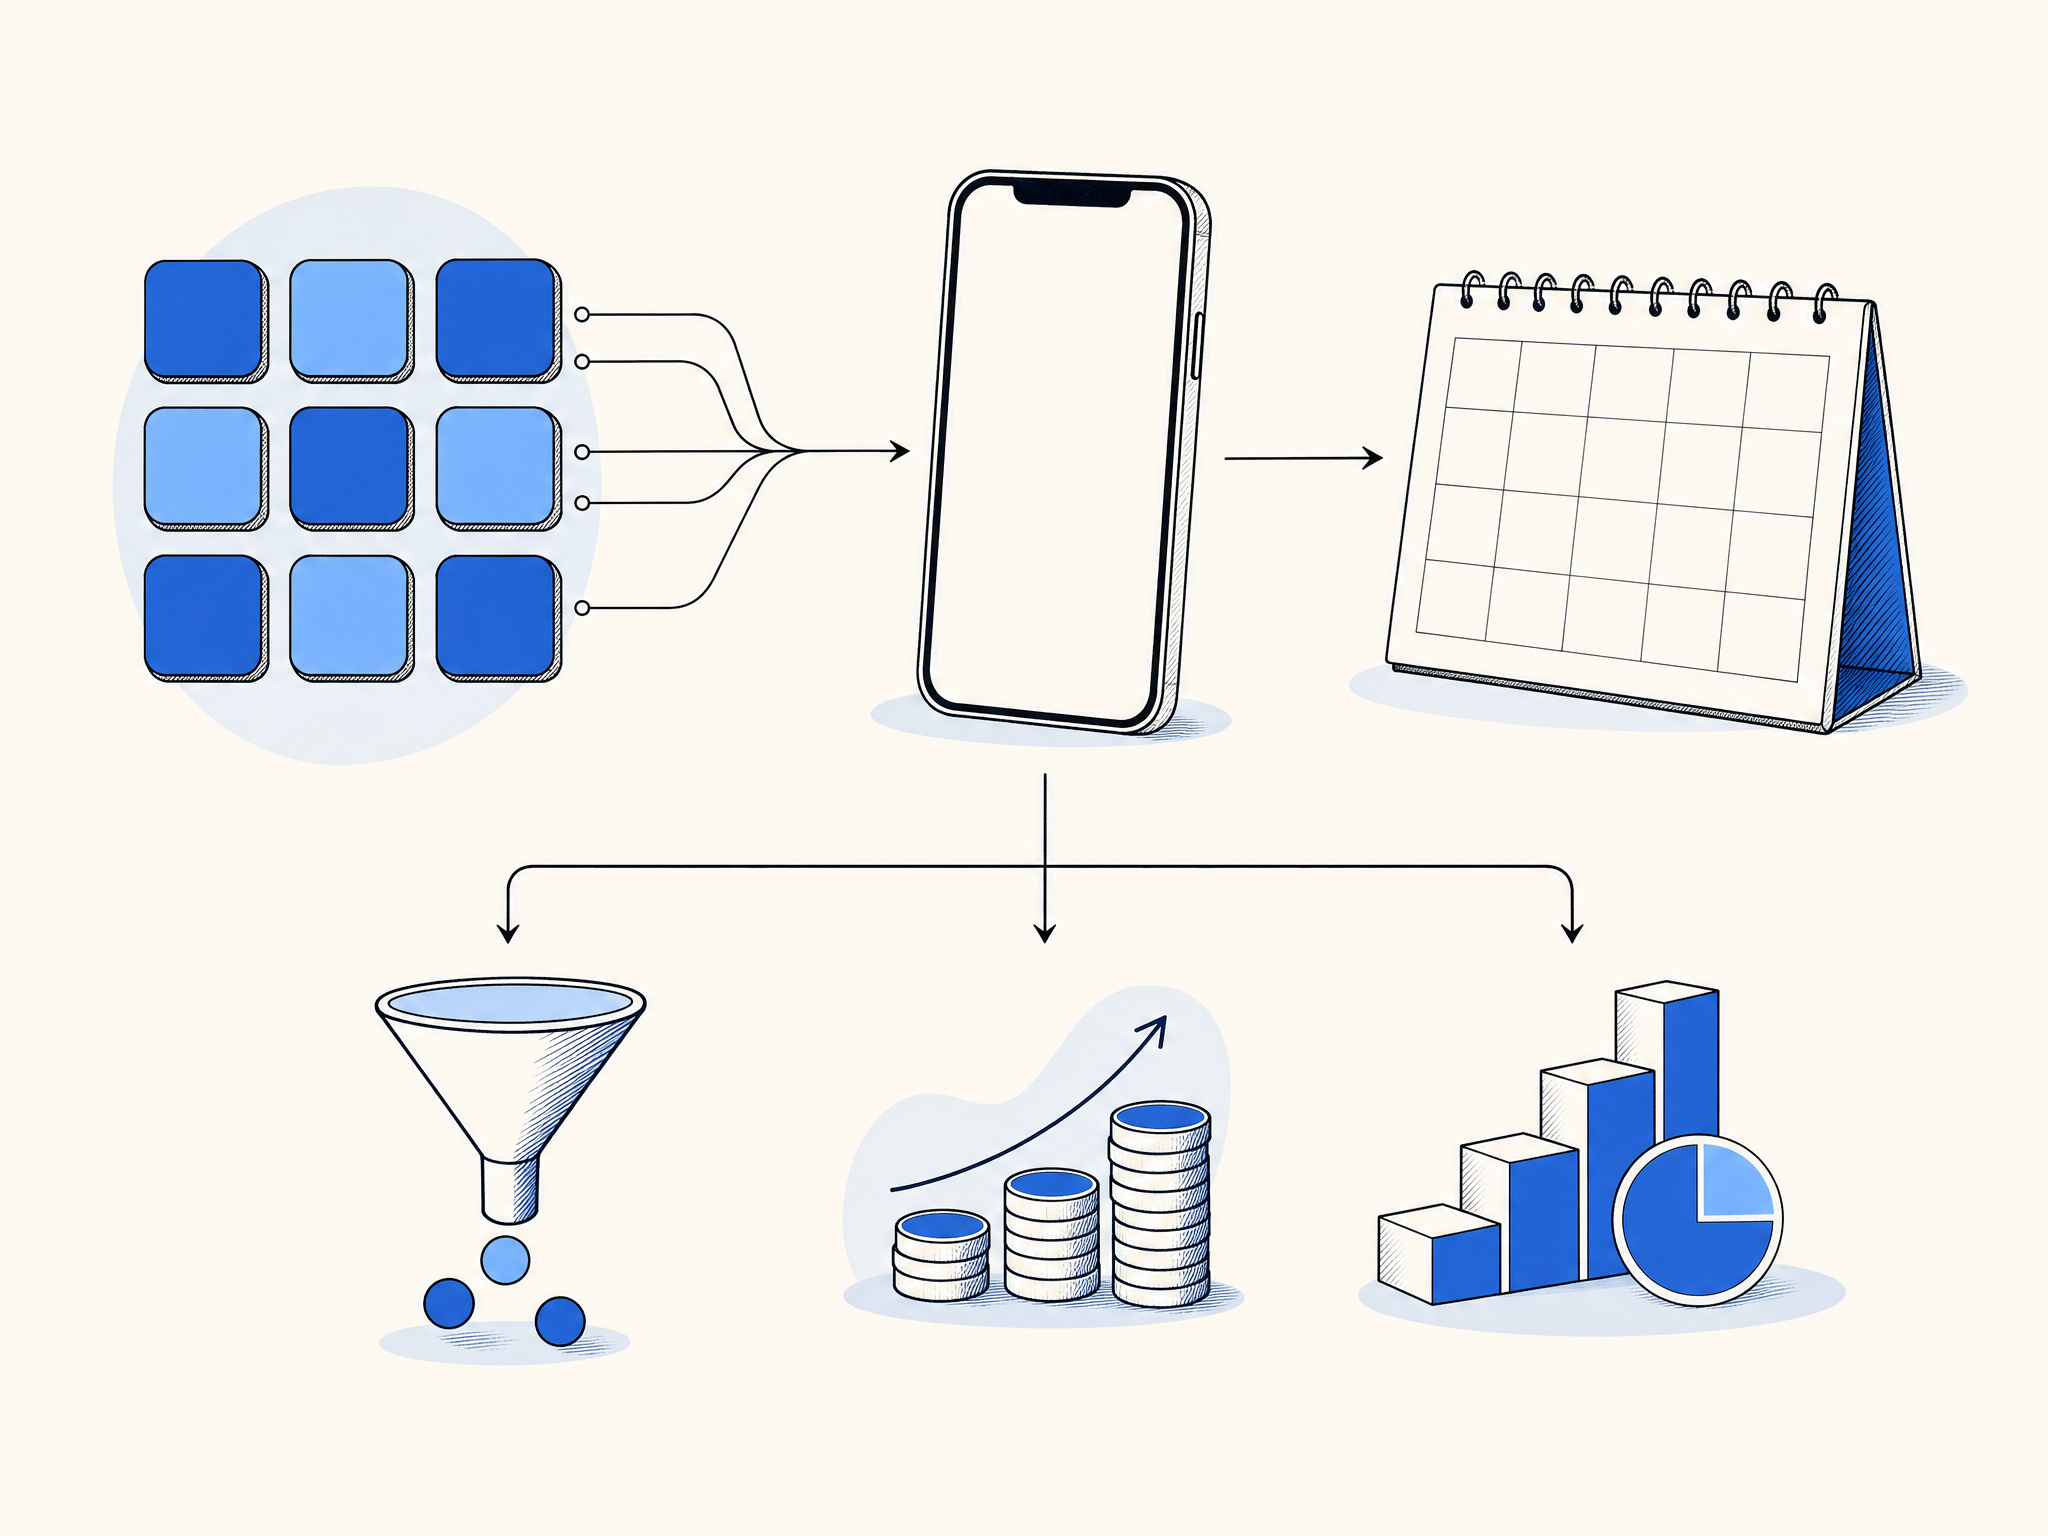
A cohort is a group of users acquired under the same rule. For paid user acquisition, a useful rule is campaign plus country plus platform plus install date. The sample below uses all players attributed to one Android campaign in the United States who installed from October 1 through October 7.
That definition keeps the denominator and numerator honest. The $2,000 cost bought this cohort. Only revenue generated by these 1,000 installs belongs in the calculation. Google Analytics also defines an acquisition cohort by the day a user was acquired in its retention overview documentation.
Build the sample cohort table before calculating
This is a sample made for this article. The fictional game generated $200 on install day, then added revenue as players returned, watched rewarded ads, and made purchases. Each revenue checkpoint below is cumulative. D7 revenue includes D0, D1, and D3 revenue already earned.
| Checkpoint | Installs | Cumulative spend | Cumulative revenue | Revenue per install | Cohort ROAS |
|---|---|---|---|---|---|
| D0 | 1,000 | $2,000 | $200 | $0.20 | 10.0% |
| D1 | 1,000 | $2,000 | $350 | $0.35 | 17.5% |
| D3 | 1,000 | $2,000 | $560 | $0.56 | 28.0% |
| D7 | 1,000 | $2,000 | $920 | $0.92 | 46.0% |
| D14 | 1,000 | $2,000 | $1,400 | $1.40 | 70.0% |
| D30 | 1,000 | $2,000 | $2,000 | $2.00 | 100.0% |
Before trusting this table, check the two inputs that cause most mistakes. Spend must include every cost charged to acquire the cohort. Revenue should use a consistent treatment for in-app purchases, ad revenue, refunds, taxes, and store fees. Pick gross revenue or net revenue for your operating view, then do not switch halfway through a report.
Calculate cohort ROAS at each checkpoint
The formula is cumulative attributed revenue divided by cumulative ad spend. Multiply the result by 100 to report a percentage.
Cohort ROAS = cumulative attributed revenue / cumulative ad spend
At D7, this cohort has $920 in revenue and $2,000 in spend:
$920 / $2,000 = 0.46 = 46.0% D7 cohort ROAS
The per-install check reaches the same result. Revenue per install is $920 / 1,000 = $0.92. Cost per install is $2,000 / 1,000 = $2.00. Then $0.92 / $2.00 = 46.0%.
At D30, the cohort has earned $2,000. $2,000 / $2,000 = 1.00, or 100.0% cohort ROAS. Google Ads describes target ROAS as conversion value for each dollar spent, which is why conversion values must be complete and consistently reported before bid targets are set. See Google Ads guidance on Target ROAS for its value and bidding context.

Use cohort ROAS to decide whether the campaign pays back
A 100.0% revenue ROAS means revenue equals media spend. It does not automatically mean profit. Suppose this game keeps 70% contribution margin after store fees, refunds, platform costs, and game operations. The D30 gross profit contribution is $2,000 × 70% = $1,400. That is still $600 below the $2,000 media cost.
The revenue ROAS needed to cover media spend at a 70% margin is 1 / 0.70 = 1.4286, or 142.9%. The cohort needs $2,857.14 in revenue to reach that mark because $2,857.14 × 70% = about $2,000. The sample reaches only $2,000 by D30, so it should not scale on this evidence alone.
| Decision check at D30 | Calculation | Result |
|---|---|---|
| Revenue ROAS | $2,000 / $2,000 | 100.0% |
| Contribution after 70% margin | $2,000 × 70% | $1,400 |
| Media payback gap | $2,000 minus $1,400 | $600 |
| Breakeven revenue ROAS | 1 / 70% | 142.9% |
There are three sensible actions. Hold spend if later revenue is reliably measured and the cohort may pass the target after D30. Reduce spend if later revenue is uncertain or the campaign is consuming budget needed by better cohorts. Improve the numerator with better creative, targeting, onboarding, or monetization before raising the bid.
Avoid mistakes that make cohort ROAS wrong
- Do not let organic installs or re-engaged users enter a paid acquisition cohort. They add revenue without the matching acquisition cost and can make a campaign look profitable. Filter the cohort to attributed new installs, then report re-engagement in its own view.
- Do not assign revenue by the calendar week in which it arrived. A purchase on October 21 from an October 2 install belongs to that October 2 cohort, even if the report runs weeks later. Join each revenue event back to the user’s install day and calculate D7 or D30 from that age.
- Refunds and mediation ad revenue can arrive after the day the player acted. Keep a late-arriving-events window and restate the affected cohort when a refund or finalized ad revenue record lands. Do not treat an early snapshot as final if those feeds are incomplete.
- Spend and revenue must use the same currency and the same revenue basis. Convert both with a documented exchange-rate rule, then decide whether the numerator is gross or net of store fees and use that choice in every cohort and payback target.
Keep the cohort view consistent as it matures
Do not compare a mature D30 cohort against a new D7 cohort as if both have had the same time to earn. Compare D7 against earlier D7 cohorts, D30 against earlier D30 cohorts, and keep country, platform, and campaign granularity where the decision lives. User lifetime reporting can also group value by the campaign responsible for a first interaction, as explained in Google Analytics user lifetime documentation.
For the first pass, save the same fields for every cohort: acquisition dates, attributed installs, spend, cumulative revenue by day, refunds, and the margin assumption. The ROAS and LTV category will build from that shared structure as more decision-ready examples are added.
Use that matched comparison when deciding whether a campaign deserves more budget.